Definition List

Tuesday, 6 October 2020

La Nina Sedang Berkembang di Samudra Pasifik, Waspadai Dampaknya di Indonesia


Hingga akhir September 2020, pemantauan terhadap anomali iklim global di Samudera Pasifik Ekuator menunjukkan bahwa anomali iklim La-Nina sedang berkembang. Indeks ENSO (El Nino-Southern Oscillation) menunjukkan suhu permukaan laut di wilayah Pasifik tengah dan timur dalam kondisi dingin selama enam dasarian terakhir dengan nilai anomali telah melewati angka -0.5°C, yang menjadi ambang batas kategori La Nina. Perkembangan nilai anomali suhu muka laut di wilayah tersebut masing-masing adalah -0.6°C pada bulan Agustus, dan -0.9°C pada bulan September 2020.

BMKG dan pusat layanan iklim lainnya seperti NOAA (Amerika Serikat), BoM (Australia), JMA (Jepang) memperkirakan La Nina dapat berkembang terus hingga mencapai intensitas La Nina Moderate pada akhir tahun 2020, diperkirakan akan mulai meluruh pada Januari-Februari dan berakhir di sekitar Maret-April 2021.

Catatan historis menunjukkan bahwa La Nina dapat menyebabkan terjadinya peningkatan akumulasi jumlah curah hujan bulanan di Indonesia hingga 40% di atas normalnya. Namun demikian dampak La Nina tidak seragam di seluruh Indonesia. Pada Bulan Oktober-November, peningkatan curah hujan bulanan akibat La Nina dapat terjadi hampir di seluruh wilayah Indonesia kecuali Sumatera. Selanjutnya pada Bulan Desember hingga Februari 2021, peningkatan curah hujan akibat La Nina dapat terjadi di Kalimantan bagian timur, Sulawesi, Maluku-Maluku Utara dan Papua.

Pada Bulan Oktober ini beberapa zona musim di wilayah Indonesia diperkirakan akan memasuki Musim Hujan, di antaranya: Pesisir timur Aceh, sebagian Riau, Jambi, Sumatera Selatan, Pulau Bangka, Lampung, Banten, sebagian Jawa Barat, sebagian Jawa tengah, sebagian kecil Jawa Timur, sebagian Kalimantan Barat, sebagian Kalimantan Tengah, Kalimantan Selatan, sebagian Kalimantan Timur, sebagian Kalimantan Utara, sebagian kecil Sulawesi, Maluku Utara dan sebagian kecil Nusa Tenggara Barat. Peningkatan curah hujan seiring dengan awal musim hujan disertai peningkatan akumulasi curah hujan akibat La Nina berpotensi menjadi pemicu terjadinya bencana hidro-meteorologis seperti banjir dan tanah longsor.

Para pemangku kepentingan diharapkan dapat lebih optimal melakukan pengelolaan tata air terintegrasi dari hulu hingga hilir misalnya dengan penyiapan kapasitas sungai dan kanal untuk antisipasi debit air yang berlebih.

Masyarakat diimbau agar terus memperbaharui perkembangan informasi dari BMKG dengan memanfaatkan kanal media sosial infoBMKG, atau langsung menghubungi kantor BMKG terdekat.

Jakarta, 3 Oktober 2020

Deputi Bidang Klimatologi BMKG
Herizal, M.Si.
source 
https://www.bmkg.go.id/press-release/?p=la-nina-sedang-berkembang-di-samudra-pasifik-waspadai-dampaknya-di-indonesia&tag=press-release&lang=ID


Monday, 28 September 2020

Java Subduction Zone Earthquake: The Worst Is Yet to Come?

Editor's Note: Indonesia, surrounded by active subduction zones, has experienced a number of large earthquakes over the last couple of centuries, including the 2004 M9.1–9.3 Sumatra-Andaman earthquake that generated a devastating tsunami. However, the worst may be yet to come, particularly for the densely populated and relatively prosperous island of Java, where the risk of high losses from earthquakes and tsunamis is steadily growing.

The thousands of islands that make up the Republic of Indonesia are surrounded by several tectonic plates, including the Indo-Australia plate, the Pacific plate, the Philippine Sea plate, and the Sunda plate (Figure 1). Their rapid convergence toward the Sunda plate has created volcanically and seismically active subduction zone faults—more than 9,000 km (6,600 miles) in total—along the island arcs, from western Indonesia eastward to the Philippines. The Southeast Asia region also hosts some of the largest active crustal faults in the world, such as the Sumatra and Sula-Sorong faults.


The Southeast Asia region has produced an estimated 18 earthquakes larger than M8.0 in the last 200 years, two thirds of which have occurred since 1900 and four since the year 2000. On average, an earthquake larger than M7.5 occurred every two to three years in the last 100 to 200 years. The high seismicity rate throughout Southeast Asia has, of course, led to frequent losses from earthquakes in Indonesia. Since 1970 (when earthquake reporting in the region began to improve), more than 25 earthquakes have caused significant deaths and/or losses. On average, Indonesia has been hit by loss-causing earthquakes every one to two years since 1992, when the M7.8 Nusa Tenggara Timur earthquake off the north coast of Flores Island killed more than 2,500 people and caused significant property damage on Flores and Babi islands from both shaking and tsunami.
Figure 1. Active faults and historical seismicity in the Southeast Asia region. Large dots indicate events larger than M7.0 since 1800; events larger than M8.0 since 1900 are labeled. (Source: AIR)


Indonesia's most catastrophic earthquake—the 2004 M9.1-9.3 Andaman–Sumatra (or Boxing Day) megathrust earthquake and tsunami in northern Sumatra and the Andaman Sea/Nicobar Island area, which killed hundreds of thousands1—resulted in a direct economic loss to Indonesia of about USD 4 billion,2 with much of the damage and loss caused by the tsunami. Although the direct economic cost was relatively modest compared to large earthquakes that have impacted more developed countries, such as Chile, Japan, and New Zealand, the casualty total from this event ranks among the highest of all known earthquakes in the world.

Does the earthquake loss experience in Indonesia from the last 40 years—or even last two centuries—provide a meaningful long-term view of risk, or should other factors be taken into consideration? Because of the relatively sparse earthquake history for Indonesia, the abundance of fault zones, and the high convergence rates in the region—notably in the Java Trench—it is not implausible that a higher-magnitude earthquake than previously experienced in the region could occur. Factor in Indonesia's growing population, increased building construction, and burgeoning economy—particularly on the island of Java—and the escalating potential for significant damage and high insured losses becomes evident.

The sections below provide four seismological observations that suggest the worst may be yet to come.

Historical Experience Limited to Low-Exposure Areas

Most of the recent significant earthquakes impacting Indonesia have occurred either around Sumatra Island, in the northwestern part of the country, or near islands in eastern Indonesia, both regions with a lower population density than Java and much less exposure at risk. Before the beginning of the 21st century, in fact, Java Island had not been impacted by a large, significant earthquake for more than half a century, long before that verdant, volcano-dotted island became a hub of financial activity and popular tourist destination, and its largest city and the nation's capital, Jakarta, emerged as a modern and prosperous metropolis.

Two cautionary earthquakes have impacted Java since the 2004 Sumatra-Andaman earthquake and tsunami, one crustal and the other an intermediate-depth (or in-slab) event.3 The 2006 M6.3 Yogayakarta crustal earthquake, although moderate in magnitude, left 2,500 dead and became the second-most damaging earthquake in Indonesian history because it impacted densely populated cities on Java. The 2009 in-slab M7.0 West Java earthquake killed more than 70 people and severely damaged property in western Java.

A high-magnitude earthquake in the Java Trench subduction zone, which lies just off the south coast of Java Island, could have a significantly greater economic impact than a similar event in the Sumatra subduction zone or the eastern islands because of the considerable socioeconomic differences between Java and the other locales. Well over half the national population calls Java home, and the island boasts robust infrastructure and significantly more exposure at risk than other parts of the country—including glittering office towers, luxury hotels, and high-end shopping malls. (According to AIR's industry exposure database, Java Island can claim 60% of the country's total property replacement value.) Insurance penetration is also higher on Java (Sumatra has comparatively low take-up rates), thus a catastrophic event could result in a sizable insurance loss. Even Jakarta, located on the northern side of the island, would likely be impacted by the shaking from a megathrust earthquake in the Java subduction zone.

Low Energy or a Short Earthquake Record?

The total convergence rate across the Java Trench is about 6 to 7 cm a year—higher than the convergence rates across most other major subduction zones in the region. In the last couple of centuries, however, the very active Java Trench subduction zone has exhibited quite low seismic activity.

As show in Figure 2, the Java Trench subduction zone is seismically least productive among the major subduction zones in the region, with the rate of seismicity of moderate-to-large-magnitude earthquakes lower than other subduction zones by a factor of 5 to 8.

Figure 2. Earthquake frequency since 1800 in the main subduction zones in Southeast Asia. The frequency is normalized by trench length (per 100 km) and adjusted by the convergence rate across the subduction zones. (Source: AIR)


The seismic coupling factor (or seismic factor)—the ratio of seismic energy released by an earthquake to the total energy accumulated—of the Java Trench subduction zone is less than 1%. Many scientists have postulated that much of the tectonic energy in the Java Trench may be released aseismically (i.e., by aseismic deformation, such as fault creep) because of this comparatively very low seismic coupling factor and the absence of large-magnitude earthquakes in the past 100 to 200 years.4

However, recent large earthquakes in other subduction zones, such as the 2011 M9.0 Tohoku earthquake in the Japan Trench and the 2004 M9.1–9.3 Andaman-Sumatra earthquake, have cast doubt on the notion that long-term fault behavior can be inferred by as little as one century of historical earthquake record. Before the Tohoku earthquake, for example, the average seismic coupling factor for the Japan Trench ranged from less than 10% to 25%, based on 100 to 400 years of seismic record. This might suggest that most of the tectonic energy in the Japan Trench would be released by aseismic deformation. However, the energy released by the Tohoku earthquake would require at least 250 to 300 years of energy accumulation in the entire trench; segments with the largest fault slip would require more than 500 years of energy accumulation. Therefore, the seismic coupling factor revealed by 100 to 400 years of historical record for the Japan Trench was not indicative of its long-term behavior. (See this article for more information.)

Given that the plate convergence rate in the Java Trench is higher than the convergence rate in the Sumatra trench further to the north, the amount of energy accumulated in the trench could be quite large. Aside from an M8.0–8.5 Java Trench earthquake in 1780 (the largest historical earthquake in the Java Trench), the trench has not had any earthquakes larger than M8.0 in the known history (200 to 300 years).

Intermediate-Depth Earthquakes Pose Another Threat
Intermediate-depth earthquakes—in-slab earthquakes associated with internal deformation of the subducting plate in the depth range from just below the typical subduction zone thrust earthquake to 200 km (125 miles) in depth—can pose significant risk to coastal cities on islands above a subduction zone. A 2009 M7.6 earthquake, for example, which occurred 90 km (56 miles) deep in the Sumatra Trench, caused significant damage in the city of Padang on the west coast of Sumatra due to its close proximity to the land area. 

Before 2007, in-slab earthquakes in the Java subduction zone were mostly moderate magnitudes (less than M7.0), and the majority occurred deeper than 500 km (310 miles) and north of the island. However, in August 2007, an M7.5 in-slab earthquake occurred near Jakarta at about 300 km (185 miles) deep. Because it was so deep, this event did not cause significant damage; in contrast, a 2009 M7.0 in-slab earthquake near the southern coast of western Java at a depth of 50 km (30 miles) damaged more than 60,000 houses.

With the Java Trench subducting slab located 50 to 250 km (30 to 155 miles) under Java Island, in-slab earthquakes can be expected to occur within this relatively shallow depth range, posing a real threat to Java Island.

Not to Be Ignored: Crustal Faults
Due to slow deformation on Java Island, few detailed neotectonic studies had been carried out on mapped faults before the 2006 M6.3 Yogyakarta earthquake, the first significant shallow crustal earthquake in the island's modern history. Although considered moderate, the earthquake killed about 6,000 people, destroyed more than 120,000 houses, and reportedly resulted in a direct economic loss in excess of USD 3.1 billion (close to the direct economic loss to the country caused by the 2004 M9.1–9.3 Andaman-Sumatra earthquake).5 In terms of loss directly caused by ground shaking, the Yogyakarta earthquake was the most damaging earthquake in Indonesia in the past century.

The severity of the Yogyakarta earthquake underscores the importance of understanding the effect of different types of earthquakes on Java's and the country's overall seismic risk. This event has triggered many new geological, geophysical, and geodetic studies.6, 7 Several faults have been determined to be active and potential sources for significant earthquakes, including the Cimandiri, Lembang, Lasem-Pati, and Opak River faults, all located close to major cities on the island, such as Bandung, Semarang, and Yogyakarta (Figure 3). Large earthquakes on any of these faults could have an unprecedented impact on Indonesia, as the affected population would be much larger than those affected by previous large earthquakes. The risks posed by these faults have been included in the latest national seismic hazard analysis,8 which has significantly elevated the seismic hazard in several large cities.

Figure 3. Recent earthquakes and active faults on Java Island. (Source: AIR9)

Summary
The densely populated and prosperous Indonesian island of Java has escaped the impact of major earthquakes in recent decades. However, because of the long length of the Java Trench and the high rate of plate convergence, and because many centuries have passed since a megathrust earthquake released accumulated energy here, many scientists contend that the potential exists for an extremely intense event in which shaking, liquefaction, and tsunami would affect not only Java Island but also coastal cities on the Indian Ocean, including in Australia. Intermediate-depth and crustal earthquakes, too, could produce large losses if they were to impact densely populated locales.

To enhance understanding of the earthquake risk for Indonesia and the Southeast Asia region, AIR has developed a comprehensive update to the AIR Earthquake Model for Southeast Asia, covering Hong Kong, Indonesia, Macau, the Philippines, Singapore, Taiwan, and Vietnam. In addition to reflecting the latest views of seismic hazard and building vulnerability—encompassing highly detailed industry exposure databases, incorporating policy conditions, and explicitly capturing liquefaction risk—the upcoming model also features a fully probabilistic tsunami model for Indonesia, the Philippines, and Taiwan.

source : https://www.air-worldwide.com/Publications/AIR-Currents/2016/Java-Subduction-Zone-Earthquake--The-Worst-Is-Yet-to-Come-/

Wednesday, 10 June 2020

Peta RBI

Berikut kami sajikan data Peta RBI Kota (digitasi JPG-shp), untuk teman teman yang membutuhkan data lain, silahkan untuk request pada kolom komentar
trimakasih


Jember
Lembar Bondowoso 1707-433
Lembar Jenggawah 1607-614
Lembar Kalibaru 1607-624
Lembar Karang Harjo 1607-623
Lembar Kraton 1607-612
Lembar Mayang 1607641
Lembar Pulau Meru 1607-343
Lembar Sarongan 1607-344
Lembar Sukowono 1607-643
Lembar Sumber gandeng 1607-622
Lembar Sumber Jati 1607-632
Lembar Sumber Salak 1607-621
Lembar Sumber Jambe 1607-644

Banyuwangi
Bondowoso
Probolinggo
Situbondo 

Data SHP Kabupaten (by Request)

Data Shp kabupaten seluruh Indonesia telah di release oleh pemerintah baru baru ini, adapaun data ini kami dapatkan di website resmi pemerintah (klik disini), akan tetapi banyak dari teman teman kesulitan dalam proses pengambilan datanya, untuk itu kami sajikan hasil download dari data tersebut, di dalam data tersebut ada bberapa file yg error akan tetapi untuk data desa, kecamatan, jalan, sungai, irigasi dll (umum) tidak ada error sama sekali.

Dalam data SHP kota ini sudah terbagi dalam potongan peta RBI (peta RBI) masing masing kota masih dalam proses digitasi dan upload
Apabila teman teman sekalian menginginkan data lainya, ada bisa request (peta spesifik)  di kolom komentar, akan kami usahakan quick respon, terutama bagi kalangan pelajar/mahasiswa yang memerlukan data tersebut (untuk pendidikan)

JAWA TIMUR
Daftar Kota 


Semoga bermanfaat bagi rekan rekan sekalian dan laporkan apabila link error
trimakasih serta silahkan request data SHP

Saturday, 3 June 2017

Trik & Tips Google Earth - Global Mapper - ArcGis

Berikut ini yang akan saya ulas adalah trik sederhana, bagaimana kita memanfaatkan sebuah aplikasi gratis yang dapat kita manfaatkan datanya (sumber data) dari sebuah aplikasi Google Earth, mungkin trik ini sudah banyak yang tau,
fungsi dan mafaat dari google earth, dari tutorial kali ini adalah kita akan mengkombinasikan / memanfaatkan antara Google Earth dengan beberapa software pemetaan dan yang di perlukan adalah software Global mapper dan juga ArcGis atau apa saja dah, jadi kita bisa memanfaatkan baik data dari masing masing software tersebut dan biasanya selain peta cetak, terkadang membuat slide lebih memahami dari tampilan view dari google earth, nah bagaimana caranya............????

Nah....... kalau yang belum tau bisa deh ikuti tutorial berikut ini........ kalau yang sudah tau / paham heehe............ pastinya bisa menyimak saja

Tips ini membutuhkan software
1. Google Earth
2. Globalmapper
3. ArcGIS

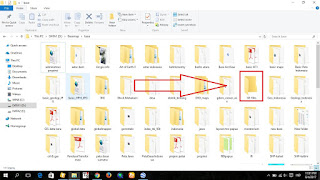
Pertama yang harus kita persiapkan selain instalasi Google earth, kita siapkan folder yang nantinya dapat menyimpan file KML/KMZ, sebagai awal saya berikan contoh bagaimana kita mengambil data jalan pada google earth sebagai berikut :
persiapkan folder untuk menyimpan file KML/KMZ
Folder

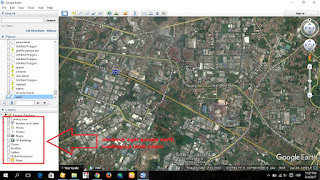
open Google Earth, kemudian uncheck database layer agar loading google earth lebih cepat, check list layer seperlunya saja
uncheck layer
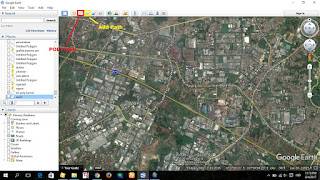
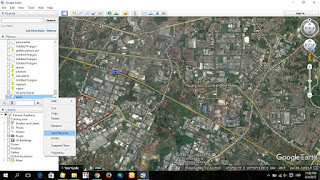
kemudian kita pilih, dalam data biew google earth apa yang akan kita buat, seperti biasa untuk area kita bisa memilih polygon, untuk garis kita memilih add path
layer
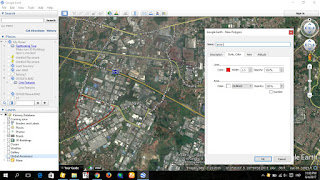
Kali ini saya contoh kan kita membuat sebuah polygon, di tiap sisi kita tandai sehingga membuat sebuah area yang kita inginkan, untuk lebih mendekati ke area yang sebenarnya di anjurkan untuk melakukan zooming. kemudian kita tentukan pewarnaan hal ini untuk menandai data yang kita ambil jangan sampai tumpang tindih dan penamaan beserta keterangan untuk nantinya data ini akan secara otomatis tersimpan data dalam file tersibut.
sample polygon
kemudian setelah kita beri nama pada area yang telah kita buat, maka file akan ada di folder place pada google earth pojok kiri, nah setelah di rasa cukup untuk melakukan copy data pada google earth, kita save file tersebut pada folder yang telah kita buat sebelumnya.
save as
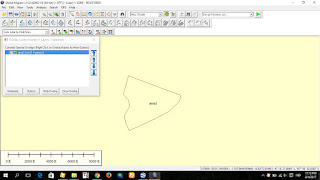
dari tips di atas, saya rasa semua bisa mengikuti tahapanya, langkah ke dua adalah kita buka Globalmapper, kemudian kita open file KML/KMZ yang telah kita simpan tadi
open globalmapper
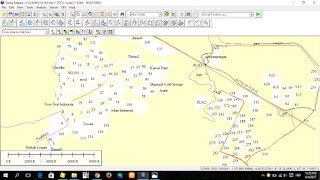
berikut adalah contoh semua file yang telah kita copy dari google earth

open file
open all file
contoh hasil peta kawasan industri di bekasi, yang sudah di olah data dengan ArcGIS


semoga tips & trik kali ini berkenan dan  bermanfaat bagi smua


Monday, 9 January 2017

GPSLogger II for android

compas view
Kali ini saya akan membahas sebuah aplikasi yang sangat berguna bagi teman teman yang ingin memaksimalkan fungsi GPS pada smartphone, fungsi GPS pada smartphone dapat kita manfaatkan secara online dan offline dan memiliki fitur yang lengkap dan kita dapat mengolah data seperti layaknya perangkat GPS personal (garmin dll).
https://play.google.com/store/apps/details?id=com.emacberry.gpslogger&hl=in
GPS Logger II
Aplikasi ini adalah GPS Logger besutan dari emacberry, pada awalnya aplikasi ini adalah meyasar perangkat blackberry, saya pribadi sering menggunakan aplikasi ini pada perangkat blackberry Bold II dimana perangkat ini sudah baik GPSnya, ketepatan titik dan mampu membaca file bentuk gpx dan kml, nah seiring perkembangan android dan smartphone android, aplikasi ini merambah pada system android dan semakin lengkap fitur fitur yang di sematkan pada aplikasi ini dan aplikasi ini gratis tidak berbayar dan apabila aplikasi ini sangat bermanfaat, teman teman skalian dapat pula mendonasikan beberapa $ (minimum 1$) untuk pengembangan lebih lanjut. untuk fungsi pada aplikasi ini bukan cuma GPS saja akan tetapi terdapat kompas, pendeteksi satelit, direction map, speed, elevation, navigasi data, navigasi direction, 
view aplikasi

setting
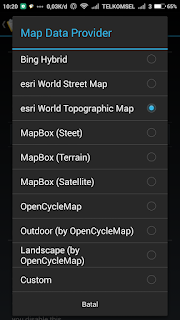
map data view


beberapa fitur secara lengkap di terangkan oleh pengembang sebagai berikut
GPSLogger II adalah aplikasi cukup sederhana yang dapat merekam lokasi berdasarkan GPS Anda dari waktu ke waktu. Awalnya dikembangkan untuk platform BlackBerry (mulai 2009) fungsi telah tumbuh terus dari waktu ke waktu. Bahkan ini adalah rilis pertama untuk Android Anda dapat mengharapkan paket yang cocok untuk semua jenis kegiatan, termasuk navigasi luar ruangan, geo-caching atau mudah menggunakan mobil finder.

Selain posisi yang sebenarnya (dalam WGS84) aplikasi akan mencatat waktu, kecepatan, menuju / saja, ketinggian, akurasi (sinyal), jumlah satelit dan (jika diaktifkan) NMEA-data mentah.

GPSLogger datang dengan banyak pengaturan yang harus memungkinkan Anda untuk menyesuaikan aplikasi untuk likings pribadi Anda, dimulai dengan pemilihan antara unit imperial, metric atau laut atau format lokasi yang berbeda [DD.MM'ss.ms ", DD.MMMMM, UTM ( + Zone), MGRS atau modus baku]. kecepatan dapat diaktifkan antara km / h atau 'menit per kM' (tentu saja juga sebagai mph dan menit per Mile).

Ada sepuluh pandangan yang berbeda (sampai tiga dari mereka dapat ditampilkan secara bersamaan) Setiap tampilan memiliki kasus penggunaan tertentu dan memungkinkan Anda untuk menyesuaikan tampilan informasi untuk kebutuhan pribadi Anda. Anda hanya dapat beralih di antara tampilan yang berbeda dengan menggesekkan kiri atau kanan.

- OpenMapData View
Saat ini penyedia OpenMapData berikut ini didukung: Google Maps | satelit, Bing Maps | Satelit | Hybrid, MapQuest OSM, MapQuest Terbuka Aerial, ESRI Dunia Street Map, ESRI Dunia Peta Topografi, OpenCycleMap, terbuka (oleh OCM) dan Landscape (oleh OCM) - juga Anda dapat menentukan URL ubin-server kustom, sehingga Anda hanya bisa menambahkan penyedia data peta lokal pilihan Anda (silahkan cek genteng server kebijakan penggunaan yang sesuai).

Harap dicatat, bahwa GPSLogger akan meminta data peta hanya sekali - sehingga dapat bekerja sepenuhnya OFFLINE sekali bahwa data peta telah tersimpan pada perangkat Anda (sebuah DesktopTool gratis tambahan juga tersedia).

- Jalur View
Bila Anda tidak memiliki koneksi data (atau telah dikonfigurasi GPSLogger bahwa tidak ada data yang harus ditransfer) tampilan jalan adalah hanya sebidang jalan logging Anda saat ini (atau jalur navigasi - atau data jalur yang telah Anda dimuat di latar belakang)

- Arah View
Secara default titik awal logging Anda akan menjadi rekor arah awal. Pandangan Arah poin Anda ke arah lokasi navigasi ini dan menampilkan semua jenis informasi tambahan seperti perkiraan waktu kedatangan (berdasarkan saat kecepatan / kecepatan rata-rata Anda), kecepatan relatif terhadap lokasi target (sangat berguna untuk berlayar) dan tentu saja ke lokasi target.

Bila Anda menggunakan GPSLogger untuk navigasi luar catatan arah akan berubah secara dinamis berdasarkan kemajuan perjalanan Anda dan ditetapkan pengaturan navigasi di luar ruangan Anda.

- Kecepatan View, Elevation View, Kompas View
Plot sederhana dari Kecepatan / Elevation nilai-nilai Anda dari waktu ke waktu dan Kompas

- GPS CoreData View
Menampilkan lokasi dan kecepatan saat ini dan tentu saja dalam font terbesar mungkin pada perangkat Anda

Sisa lainnya 3 views Navigasi Direction, Navigasi GPS Core Data dan Kecepatan Navigasi bisa sangat berguna ketika Anda menggunakan fungsi navigasi luar diperpanjang - sebenarnya aku telah menerapkan mereka untuk penggunaan pribadi saya ketika saya naik dengan MTB tersebut.

Fungsi inti:
======================
GPSLogger
Speedometer
CarFinder / Ambilkan Depan
Navigasi luar ruangan
Geocaching dan Waypoint Manajemen
AutoEmergency Siaga
Impor dan Ekspor KML atau GPX
100% OFFLINE


PERSYARATAN
======================
Perangkat Android® dengan membangun di GPS Antenna (atau aktif & sudah dipasangkan Bluethooth GPS-Puck)
Gunakan GPSLogger II di luar ruangan - Penerimaan sinyal GPS di dalam gedung bisa sangat buruk atau bahkan tidak tersedia sama sekali.


Friday, 18 November 2016

Data GPS shp

Maaf bagi teman - teman, yang mungkin sudah atau menginkan data shp atau chat via box tentang beberapa data yang di perlukan dan baru bisa saya penuhi hari ini, karena ada beberapa kesibukan saya pribadi sehingga belum sempat membalas email atau menengok blog yang sederhana ini, beberapa file juga sudah terhapus dari eksternal hardisk, karena dulu sebelum saya unggah semua, saya rasa sedikit saja teman teman yang memerlukan data tersebut, tapi ternyata cukup banyak yang memerlukan data tersebut.
Kali ini saya akan membagikan beberapa data GPS yang sudah saya olah dalam bentuk file shp dan mungkin teman teman sekalian memerlukanya, seperti pada screenshoot di bawah ini

jadi data dari GPS garmin, saya olah menjadi shp, sebenernya caranya cukup simple, ok gak usah banyak bertele tele sudah, akan saya bagikan free....... 

Beberapa data yang bisa terselamatkan, karena smua terhapus hehehe..............
Data Base
Nangro Aceh Darussallam
Bali
Bangka Belitung
Banten
Bengkulu
Gorontalo
Irian Jaya Barat / Papua Barat
Jakarta
Jawa Barat
Jawa Tengah
Jawa Timur
Kalimantan Barat
Kalimantan Selatan
Kalimantan Tengah
Kalimantan Timur
Kepulauan Riau
Lampung
Maluku
Maluku Utara
Nusa Tenggara Barat
Nusa Tenggara Timur
Papua / Irian jaya
Sulawesi Barat
Sulawesi Selatan
Sulawesi tengah
Sulawesi Tenggara
Sulawesi Utara
Sumatra Barat
Sumatra Selatan
Sumatra Utara
Yogyakarta


Friday, 4 March 2016

Peta RBI Papua

Sehubungan di galakanya pembangunan di Propinsi Papua dan Papua Barat, tentunya sangat di butuhkan informasi peta rupa bumi (RBI)
untuk memudahkan memperoleh peta, berikut saya upload peta rupa bumi Propinsi Papua Barat dan Propinsi Papua yang di keluarkan bakosurtanal, semoga informasi peta RBI ini berguna bagi yang membutuhkan, khususnya di kalangan pelajar / mahasiswa yang sangat membutuhkanya
Peta RBI Papua dan Papua Barat
Peta yang di sajikan full tanpa kompres sehingga bisa di pergunakan sebagai basemap, layout, untuk di pergunakan pada software pemetaan.
Basic informasi ini untuk semua kalangan, smoga bermanfaat

index RBI

Thursday, 3 March 2016

Pengumuman CNC ke 17 Dan Pencabutan

baru baru ini dijen / kementrian minerba menerbitkan status CNS ke 17
berikut link download daftar perusahaan yang telah tercantum pada pengumumman CNC ke 17
download Cnc Ke 17

untuk SK pencabutan
download sk pencabutan


semoga bermanfaat


source : minerba

Monday, 27 April 2015

Share Map Database free

Ilmu selayaknya di bagikan


sementara kunjungan dan downloader mania